

REPORTS & ANALYTICS
Landing page, campaign, device type, browser, and day of week are all things a report can group by. 44 dimensions and 49 metrics sit on one field list.
REPORT BUILDER
Nine ready-made reports cover day one; 93 fields cover the question they do not answer.
What a category actually earned, what the shelf is worth tonight, and how a supplier has performed are three separate reports. They read three separate bodies of data. The fields for all of them come off the same panel, and each report is built by drag and drop.
Marketing is the biggest category with eleven dimensions: traffic source, medium, campaign, landing page, page referrer, marketing channel, device type, browser, and operating system among them. Location adds six, from billing country down to shipping city. Cart adds four, including order coupon and shipping tier.
Financial holds nineteen measures, volume eleven, inventory nineteen. Financial goes past revenue to average discount, average tax, shipping total, refund amount, and fulfilment rate. Volume counts items sold, order count, units per order, and refund count. Inventory covers stock value, average cost, potential revenue, understock quantity, and overstock quantity.
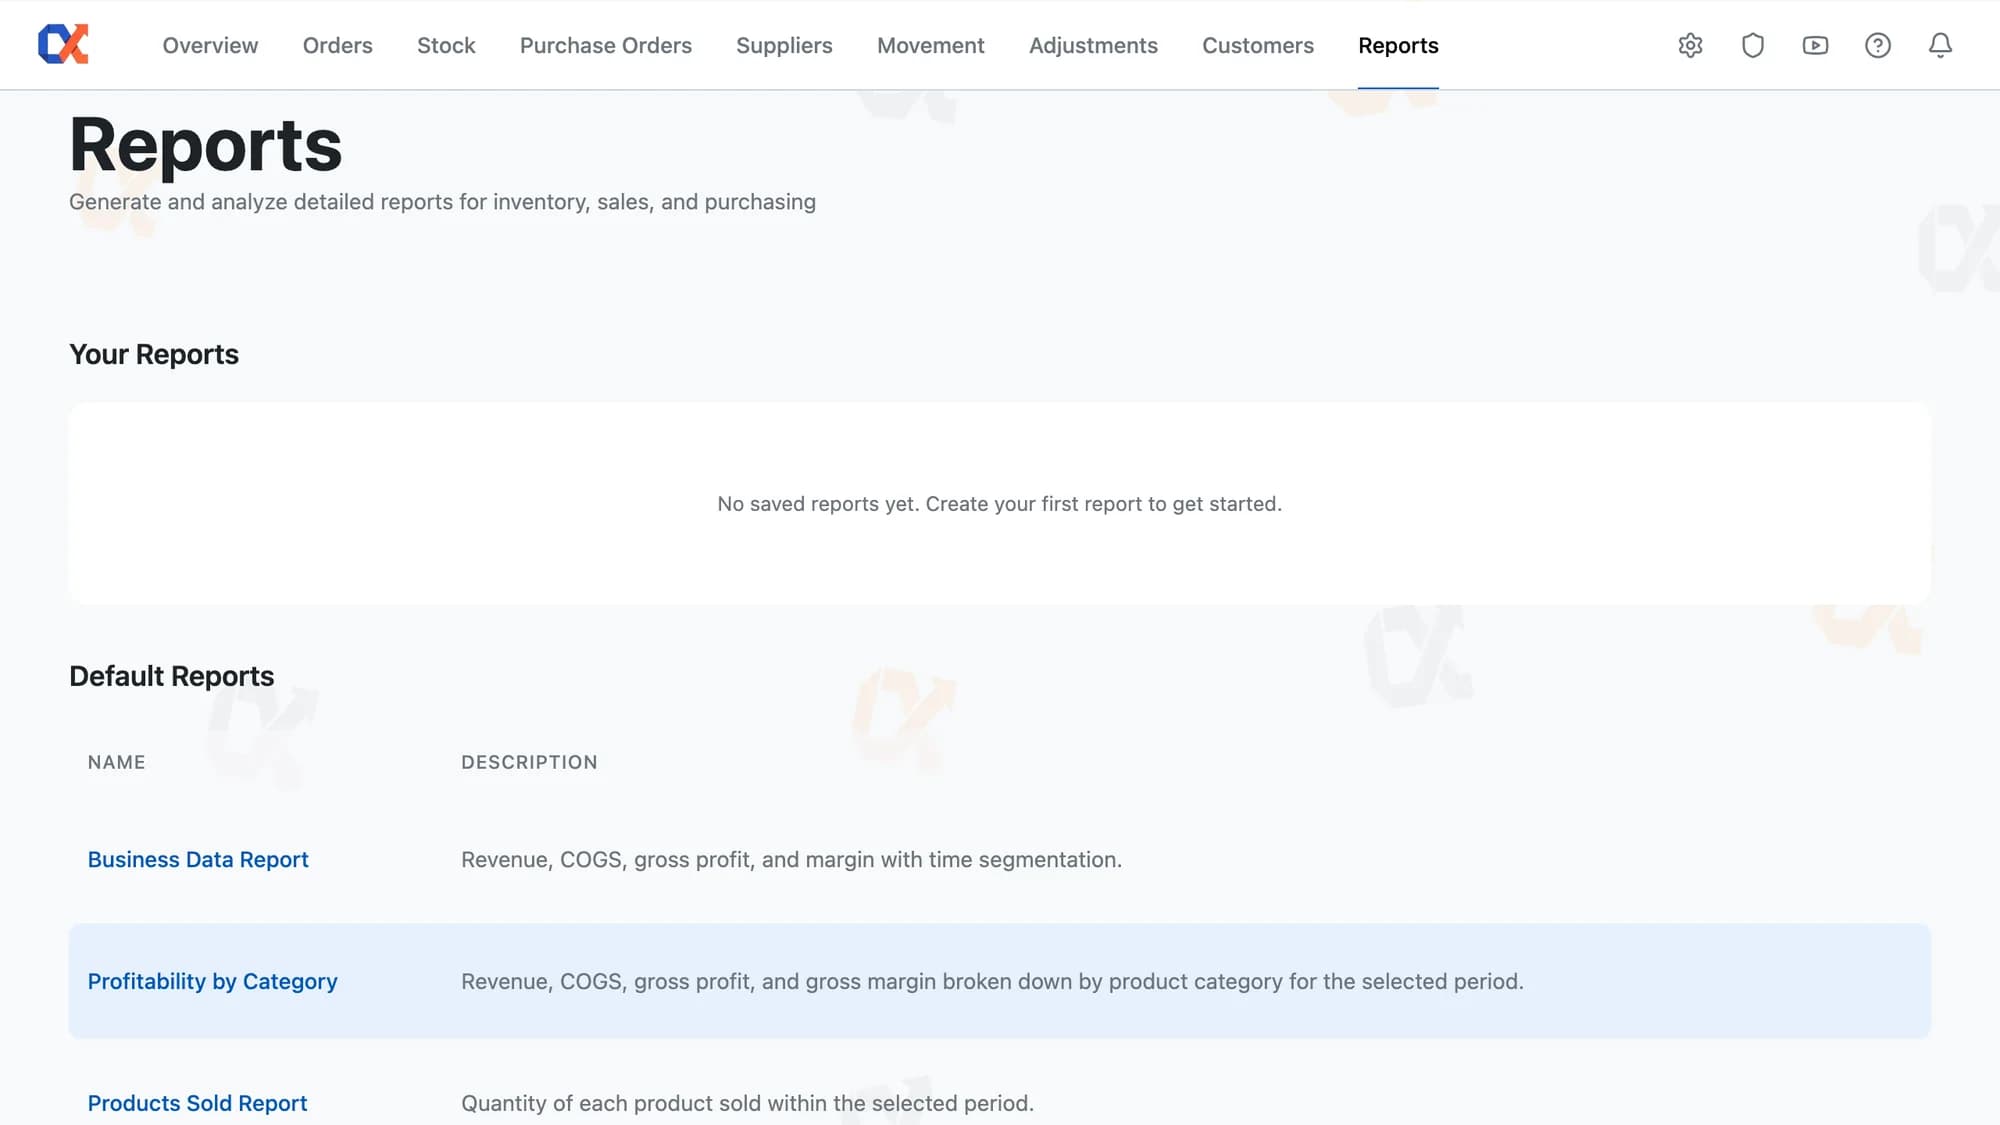
Business Data Report, Profitability by Category, Products Sold, Sales Per Channel, and Traffic Attribution cover the trading side. Stock Health, Stock Value, Purchase Order Summary, and Supplier Performance cover the rest. Each arrives with its own date window, rows, values, sort order, and row cap already set.
You set the row cap yourself. Show Rows controls what appears on screen, at 10, 25, 50, or 100, and Start Row controls where it begins. The export uses neither. Download CSV writes every row the report found, to a ceiling of ten thousand rows.
BUILDING A REPORT
Running the report again later takes one click, on the shape already saved.
Click the + beside Dimensions, tick fields from any category, and click Apply. Metrics work the same way, with a search box that narrows the list as you type. The fields you ticked gather in the panel on the left, not in the report itself.
Drag a dimension into Rows and a metric into Values. The canvas reads Ready to run the moment a metric is in place. Dragging a field into Filters narrows the set instead of grouping or measuring it.
Set the date range from eleven presets or a custom calendar, then click Run Report. A caption above the result gives the row count, and switching visualisation fetches a fresh set of rows for the new view. Clicking a column heading re-sorts what is on screen.
Download CSV switches on in the canvas toolbar the moment a report has been run. The file holds the whole run, however few rows the screen showed.
ONCE THE REPORT RUNS
Every measure in a report gets a Total row worked out from its own underlying figures.
Which products gained and which slipped, with a percentage change on each one.
Table, bar, line, pie, and scatter each carry their own set of display controls.
Mobile against desktop on every metric, each with its own column and a delta between them.
Ask for stock value over £500 and only the products above it come back.
Your Reports holds every report you have saved, tied to your own login.
WHAT ONE BUILDER COVERS
A store asks four kinds of question. What sold and what it earned; what sits on the shelf and what it is worth; what moved in or out and when; what was bought in and from whom. All four are built the same way, by dragging fields into rows and values. The answer comes back on the same screen the fields were picked on.
A report takes its subject from what it measures. Ask for revenue and it reads orders; ask for stock value and it reads the shelf; ask what was spent with a supplier and it reads purchase orders. One subject at a time, and every field on the panel bends to it. That is what lets one builder cover ground that usually needs several tools.
HOW IT COMPARES
Nine reports on install, a builder for the tenth, and gross profit from what you actually paid.
| Capability | Default WooCommerce | ATUM Inventory | Shelf Planner | Inventory Alpha |
|---|---|---|---|---|
| Drag-and-drop custom report builder | – | – | – | |
| Reports across orders, stock, and POs | – | |||
| Gross profit and margin from FIFO cost | – | – | ||
| Nine ready-made reports on install | – | – | ||
| Table, bar, line, pie, and scatter views | – | |||
| Period-over-period comparison with % delta | – | – | ||
| Traffic-source segments on sales reports | – | – | – | |
| Full-result CSV export past the row cap |
WORKS WITH YOUR STACK
No data migration, no separate dashboard. Inventory Alpha installs as a standard plugin and reads your existing WooCommerce orders and products.
Start free
Open a ready-made report on day one, then build your own once you have a sharper question. Each runs again the next time you open it.
Not charged for 30 daysCancel anytime5‑minute setup
The rest of the toolkit
Reorder levels, costs, bulk edit
Low stock → ordered → received
Spend, AOV, and churn risk
The whole business on one screen
Who you buy from, at what cost
Why a stock number changed
Correct stock by hand, logged
None, View, or Full per page
Profit per order, pick and pack